In the fast-evolving world of stock trading, understanding technical indicators has become more crucial than ever. With the rise of AI-based trading tools and modern charting platforms in 2025, investors — both beginners and seasoned traders — rely on technical indicators to identify profitable entry and exit points. Among hundreds of indicators available, RSI (Relative Strength Index) and MACD (Moving Average Convergence Divergence) remain two of the most reliable and time-tested tools used by traders worldwide.
This guide will help you understand what RSI and MACD are, how they work, and how you can effectively use them in 2025 to improve your trading performance — whether you are doing intraday, swing, or positional trading.
What Are Technical Indicators?
Technical indicators are mathematical calculations derived from a stock’s price, volume, or open interest data. They help traders:
- Identify trends and momentum
- Detect overbought or oversold conditions
- Confirm potential trend reversals
- Determine entry and exit points
While fundamental analysis focuses on company performance, technical indicators focus on price behavior, assuming that all information is already reflected in market price movements.
Understanding RSI (Relative Strength Index)
What is RSI?
The Relative Strength Index (RSI) is a momentum oscillator developed by J. Welles Wilder. It measures the speed and change of price movements on a scale from 0 to 100.
- RSI above 70: The stock is considered overbought (may correct or fall soon).
- RSI below 30: The stock is considered oversold (may rise soon).
How RSI Works
RSI compares the average gains and losses of a stock over a specific period, usually 14 days, using the following formula:
Where RS (Relative Strength) = Average Gain / Average Loss
How to Use RSI in 2025
With modern AI-driven platforms like TradingView, Zerodha’s Kite, and Upstox Pro, RSI can now be customized and combined with trend filters. Here’s how you can use it effectively:
- Identify Overbought/Oversold Levels
- When RSI > 70 → Potential reversal or correction zone.
- When RSI < 30 → Possible bounce-back or recovery zone.
- Look for RSI Divergence
- Bullish Divergence: Price makes a lower low, but RSI makes a higher low → Indicates potential upward reversal.
- Bearish Divergence: Price makes a higher high, but RSI makes a lower high → Warns of a possible downward reversal.
- Use RSI for Trend Confirmation
- RSI between 50–70 in an uptrend shows strong bullish momentum.
- RSI between 30–50 in a downtrend shows sustained bearish momentum.
- AI-Powered RSI Alerts
In 2025, platforms use AI algorithms to automatically detect divergences and send alerts, helping traders act faster without manually monitoring charts.
Understanding MACD (Moving Average Convergence Divergence)
What is MACD?
The MACD is both a trend-following and momentum indicator, developed by Gerald Appel. It helps traders understand the relationship between two moving averages of a stock’s price.
MACD Components
- MACD Line = 12-day EMA – 26-day EMA
- Signal Line = 9-day EMA of MACD Line
- Histogram = Difference between MACD Line and Signal Line
How to Interpret MACD
- MACD Line Crossing Above Signal Line → Bullish Signal
Indicates momentum is shifting upward. - MACD Line Crossing Below Signal Line → Bearish Signal
Suggests downward momentum or trend reversal. - Zero Line Crossovers
- MACD > 0 → Stock in uptrend
- MACD < 0 → Stock in downtrend
- Divergences
- Bullish Divergence: Price makes lower lows while MACD makes higher lows.
- Bearish Divergence: Price makes higher highs while MACD makes lower highs.
How to Use MACD in 2025
With advanced charting tools, MACD in 2025 can be optimized for multiple timeframes:
- 15-min or 1-hour charts for intraday trading.
- Daily or weekly charts for swing/positional trading.
AI platforms now integrate pattern recognition with MACD signals — helping traders identify trend changes earlier with backtested accuracy data.
RSI vs. MACD: Which One Should You Use?
| Parameter | RSI | MACD |
| Type | Momentum Oscillator | Trend + Momentum Indicator |
| Range | 0–100 | Unlimited |
| Best for | Overbought/Oversold identification | Trend confirmation |
| Signal Type | Divergences and reversals | Crossovers and momentum shifts |
| Ideal Timeframe | Short to medium term | Medium to long term |
| Strength | Quick reaction to price changes | Smoother trend tracking |
Conclusion: Use both RSI and MACD together for stronger confirmation. For instance, if RSI shows oversold and MACD shows bullish crossover, it can be a strong buy signal.
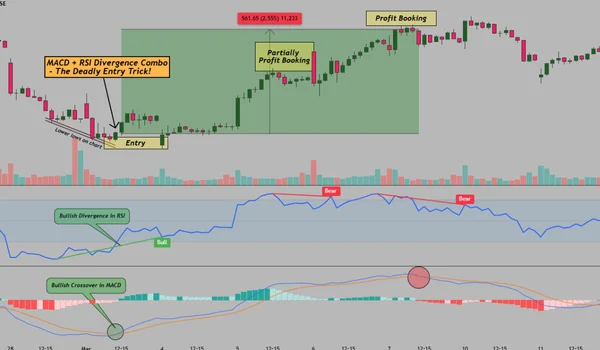
Practical Trading Strategy Using RSI and MACD (2025 Edition)
- Entry Rule
- Wait for MACD bullish crossover (MACD Line > Signal Line).
- Confirm that RSI is below 40 and rising — showing improving momentum.
- Exit Rule
- Exit when RSI crosses above 70 or MACD shows bearish crossover.
- Stop-Loss and Risk Management
- Always place a stop-loss below the previous swing low.
- Avoid overtrading based solely on RSI/MACD without considering volume or trendline confirmation.
- AI-Driven Enhancements
In 2025, many trading apps use AI-enhanced RSI-MACD strategies that automatically:
- Detect fake breakouts
- Filter false crossovers
- Provide probability scores for trade setups
Tools like Smallcase Edge, Zerodha Streak, and QuantMan offer backtested algorithms for beginners who want to automate RSI-MACD-based strategies without coding.
Common Mistakes to Avoid
- Relying on a single indicator – Combine RSI/MACD with support-resistance and volume analysis.
- Ignoring the larger trend – Always trade in the direction of the broader market (Nifty50 or Sensex trend).
- Using default settings blindly – Customize RSI (e.g., 9 or 21 period) and MACD (e.g., 5-35-5) for different stocks or timeframes.
- Emotional trading – Stick to data-backed signals, not gut feelings.
Conclusion
In 2025, mastering technical indicators like RSI and MACD is not just about understanding formulas — it’s about combining data, discipline, and technology. Whether you are a beginner exploring charts or a retail investor aiming for consistent profits, these tools help you decode market psychology and make smarter trading decisions.
As AI and automation continue to reshape the stock market, integrating RSI and MACD with AI-driven analytics can give you an edge over the average trader. Remember: indicators guide you, but your success still depends on patience, risk control, and strategy consistency.

Shashi Kant is the Founder and Editor of BusinessScroller.com, a leading platform for business insights, finance trends, and industry analysis. With a passion for journalism and expertise in business reporting, he curates well-researched content on market strategies, startups, and corporate success stories. His vision is to provide valuable information that empowers entrepreneurs and professionals. Under his leadership, BusinessScroller.com has grown into a trusted source for in-depth articles, customer care guides, and financial expertise.