
Spotting a head and shoulders, triangle or double bottom on a chart may seem straightforward. The difficult part is deciding whether what you see is actually a meaningful pattern.
Two charts can contain similar shapes but develop in completely different market conditions. A triangle forming during a strong trend does not carry the same context as a similar-looking formation appearing in a directionless market.
This is where traders usually misinterpret the charts. They focus on matching the shape while overlooking trend, price levels, volume and confirmation. Understanding chart patterns requires reading the conditions around them, not simply recognising an outline.
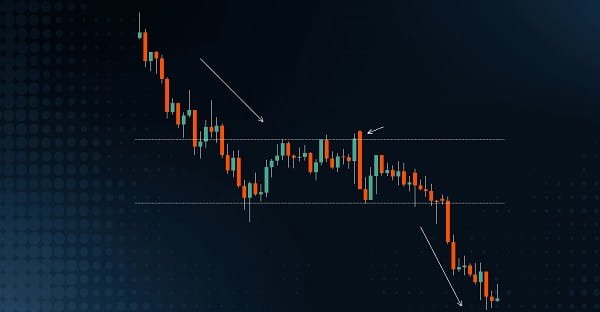
Why chart patterns are commonly misread
Chart patterns represent price behaviour over a period. While trading chart patterns, interpretation depends on how the pattern forms and what happens around it. Several mistakes can distort that interpretation.
1. Identifying the pattern too early
Many formations become clear only after price has developed sufficiently. Trying to label them before completion can lead to unexpected outcomes.
Think about the double bottom. Even though price touching a similar low twice may look like the pattern, it alone does not complete the pattern. Traders typically look at the level of resistance that exists between the two lows, called the neckline, to see if price breaks above it.
2. Ignoring the existing trend
A pattern should not be separated from the price action that came before it. Some patterns are interpreted differently depending on the preceding trend.
Take the head and shoulders pattern. It is generally treated as a bearish reversal formation when it develops after a bullish rally. An inverse head and shoulders, on the other hand, is associated with a potential bullish reversal following a bearish rally.
3. Treating every breakout as confirmation
A breakout is not guaranteed simply because price has moved beyond a support or resistance level. It can move beyond the structure at times but return.
This is why traders often look for additional evidence before treating a breakout as meaningful. They may observe whether price closes beyond the relevant level, how volume behaves or whether the breakout receives follow-through in subsequent price action.
4. Drawing support and resistance too precisely
Support, resistance, necklines and trendlines play an important role in chart-pattern analysis. A common mistake is treating these levels as exact prices that the market must respect.
In practice, price can briefly move above or below a level before changing direction. It can therefore be more practical to think of some support and resistance areas as zones rather than perfectly precise lines.
5. Looking at the pattern in isolation
A chart pattern provides information about price structure, but it does not show everything happening in the market.
Volume, for example, can add context to a breakout. Broader support and resistance can show whether a pattern is developing near an important historical price area. Traders may also use indicators to study momentum or trend conditions alongside the pattern.
How to read chart patterns more effectively
A more structured approach can reduce the tendency to label every familiar shape as a trading signal.
Start by checking the trend before the formation. Then identify the major swing highs and lows that create the pattern. Mark the relevant support, resistance, neckline or trendline and wait for the structure to become sufficiently clear.
Then observe how price behaves near the level that would confirm the pattern. Rather than focusing only on whether price crosses that level, consider the surrounding price action and any other information being used in your analysis, such as volume.
Conclusion
Most of the traders go wrong in identifying the pattern because they focus too heavily on the shape and completely ignore the context. Some traders enter too early by assuming the pattern is complete, overlook the previous trend, and depend too heavily on precise price levels; these factors lead to misinterpretation.
A more practical approach is to read the complete setup: the prior trend, pattern structure, important price levels and behaviour around confirmation.

Shashi Kant is the Founder and Editor of BusinessScroller.com, a leading platform for business insights, finance trends, and industry analysis. With a passion for journalism and expertise in business reporting, he curates well-researched content on market strategies, startups, and corporate success stories. His vision is to provide valuable information that empowers entrepreneurs and professionals. Under his leadership, BusinessScroller.com has grown into a trusted source for in-depth articles, customer care guides, and financial expertise.